
Drawing
tools
Vivien includes the following drawing tools:
These are described in the next sections.
Customizable origin
By default, the origin is set at the center
point of the Vivien venue defined for the event. (For more information
on venues, see “Defining
the venue”.) You can reset the origin to another point in your
drawing so that a different point assumes the values (0,0,0).
To set the user
origin
- From the menu,
choose .
or
Click the Origin tool
on the Tools toolbar.
 The Origin button.
- Click a point on your drawing or type in the coordinates
(X, Y, Z) for the point that assumes the values 0,0,0.
Note: When you start typing, the Command
Line prompt automatically appears at the bottom of the window.
To reset the user origin
From the menu,
choose .
Result: This resets the origin back to the Vivien
default origin.
Freehand
drawing mode
You can draw objects using a dialog box
to set the object’s size (width, depth and height for example). Once you
set the object dimensions, the full-size object is then attached to the
cursor so you can place it in the drawing.
Alternately, you can draw objects in freehand
mode by clicking the Freehand button
in the object dialog box. Freehand Mode allows you to click an insertion
point for the object first, then drag to create the extents of the object
as allowed by the view (XY for plan view, XZ for front view, and so on).
For risers and cylinders, once you have
set the dimensions, a dialog box opens to allow you to set the third dimension,
if required. Freehand Mode works with Walls, Risers, Cylinders, Circles,
Arcs, and Spheres.
To set Freehand Mode
as the default drawing mode
- From the menu,
choose .
- Click the User tab.
- In the Options section,
check Freehand object creation.
- Click OK.
To set Freehand Mode
on the fly
From the menu,
choose .
or
Click the Freehand
Mode tool on the Tools toolbar.
 The Freehand Mode button.
Remember to click the Freehand Mode
tool again to leave Freehand mode.
The
Height value
The coordinate not represented in the 2-dimensional
Plan view of your drawing is called Height and is assigned the axis letter
z. In Plan view, you cannot move an object in your drawing in the direction
of the Height value (i.e., up and down from floor to ceiling); you can
only move objects along the x and y axes. In Plan view, the status bar
identifies the Height value as z=[value].
Notes:
- In the other 2D views (side views and front/back),
the direction in which you cannot move objects is assigned different
axis letters, based on the view. For example, in a side view, you
can move objects from floor to ceiling (z axis) and from left to right
(y axis) in the room, but you cannot move objects into the center
of the room (along the x axis). Notice in these views that when you
move your mouse, the coordinate value for this axis on the status
bar does not change.
- For 3D perspective views you are still limited
to working in two dimensions. To work in a 3D view, you set the workplane
(the 2-dimensional plane that you want to work in).
When you place objects on drawings in the
Plan view, by default they are placed on the floor (z=0). To place objects
on a surface higher than the floor (for example, a stage), you could first
place them on the floor, switch to a view where z is not the Height value
(for example, the Front view) and manually drag the object up.
A simpler technique is to change the Height
value in Plan view, in effect shifting the floor up. When you change the
Height value for the Plan view from z=0 to some other value, for example
z=4, all objects placed in that view are placed 4 feet above the ground
(or 4 meters if you are using the Metric system). Although you cannot
see the difference in the Plan view, you can see it when you switch to
Left, Right, Front, Back and 3D views of the room. The Height value affects
all subsequent objects inserted in the Plan view; it does not affect objects
that are inserted in any other view type.
Note: The Height value is not a move tool. Objects
are not moved to the Height value. The Height value only affects subsequent
inserts.
To enter a value for the Height
- From the menu,
choose .
or
Click the Height tool on the Tools toolbar.
 The Height button.
Result: The Enter the Height
dialog box opens.
- Type the value in the Height box,
and then click OK.
Snaps
Snaps are used to assist in the drawing
and placement of objects. When a snap setting is active, the cursor is
drawn to the applicable snap point, like a magnet. You can have multiple
snaps active at the same time.
To toggle snapping on and off
From the menu,
choose and then click .
Result: A check mark displays beside Snap
State when snapping is on. No check mark displays when snapping
is off.
Note: You can turn snapping on at any time by selecting
a snap type from the Tools toolbar.
To select a snap type
- From the menu,
choose and then click one
of the snap types described next.
or
Click a snap type on the Tools toolbar.
- Repeat step 1
until all desired snap types are selected.
 Grid snap
Aligns the placement of objects to grid
points. You can set the grid interval and angle in the Draw
Options tab of the View Options window.
 Endpoint snap
Aligns the placement of objects to the
end-point of a line, arc, pipe, or any other object.
 Midpoint snap
Aligns the placement of objects to the
mid-point of a line, arc, or any other object.
 Point
snap
Point
snap
Aligns the placement of objects to a point
in the drawing.
Light fixture
insertion points are considered as points. Therefore, you can align the
placement of objects to light fixtures (snap to light fixtures), using
the Point Snap.
 Intersection
snap
Intersection
snap
Aligns the placement of objects to the
intersection of lines, circles or arcs on the same plane.
 Center
snap
Center
snap
Aligns the placement of objects to the
center-point of circles or arcs on the same plane.
Aligns the placement of objects to the
volumetric center-point of risers and spheres.
To snap to the center of a circle, arc,
elliptical arc, risers, or spheres, hover around that center-point in
the space of the circle, arc, elliptical arc, risers, or spheres.
 Library snap
Library Snap
displays snap points at the bounding box corners of the library item which
aligns the placement of the object in the drawing. The insertion point
is identified as the single snap point in a corner that is displayed in
red if the object is not selected, which will turn to green if the object
is selected. Refer to “Using
library snap”for more details.
Insertion
points
Insertion points are pre-defined snap points
on a 2D/3D primitive object or Library object that are used as insertion
grips when placing objects into your drawing.
This feature allows you to choose the Insertion
Point from a list of pre-defined Insertion Points. Drawn objects or Library
objects use a default insertion point. When you choose a different Insertion
Point, the object will shift around the cursor, to the specified Insertion
Point. The object will automatically use the same Insertion Point that
was previously selected until changed.
Insertion Points for Library objects will
only display if Library Snapis enabled. See “Using
library snap” for more details.
To select the object’s insertion point
- Choose a 2D or 3D object to draw, or select an
object from the Library.
- Set or change the object’s specifications in the
settings dialog box that appears.
- Click OK.
Result: Your cursor snaps to the default insertion
point of the object.
- Right-click the object to display the menu list
of insertion points.
- Click on the new insertion point.
- Place the object into your drawing.
To select the Library object’s insertion point
See “Specifying
library item insertion point”.
Changing insertion
points
You can change the insertion point of a
single 2D/3D primitive object in your drawing to another insertion point.
You can select only one 2D/3D primitive object to change its insertion
point. You can change the insertion points of rectangles, arcs, elliptical
arcs, polygons, risers, cylinders, cones, spheres, walls, and screens.
To change the object’s insertion point
- Select a 2D or 3D object in your drawing.
- From the menu, choose ,
and click on the new insertion point from the menu list of insertion
points.
Tip: You can right-click on the selected object,
choose , and click on
the new insertion point from the menu list of insertion points.
Result: The insertion point of the selected object
moves to the new location.
Orthographic
mode
Orthographic Mode is
used to constrain your mouse movement and drawing to a direction parallel
to a specified axis. This is useful for placing objects in alignment.
When Orthographic
Mode is inactive, you can draw or move objects in any direction
on the workplane.
The view type determines the possible axes
of movement; XY for plan views, YZ for side views, XZ for front and back
views.
To activate orthographic mode
From the menu,
choose and then click
.
or
You can activate Orthographic
Mode at any time by clicking the Ortho tools
on the Tools toolbar.
To select an axis of movement
From the menu,
choose and then an axis
of allowed movement.
or
Click an Ortho tool
on the Tools toolbar.
 : X-Axis
Allows movement in the X-direction.
 : Y-Axis
Allows movement in the Y-direction.
 : Z-Axis
To cancel and reset ortho buttons
- From your keyboard, use F8 to
disable any ortho buttons that you have chosen.
- Use F8 again
to reset the same ortho selection as that which was previously selected.
Ortho
lock for single axis scrolling
From your keyboard, you can use ALT
+ F8 to enable Ortho mode for only one axis of the current
view or workplane.
- Press ALT + F8 for
the first time to enable the first Ortho axis of the current view
or workplane regardless of the current Ortho state (i.e. both axes
on or both axes off).
- Press ALT + F8 for
the second time to disable the first Ortho axis and enable the second
Ortho axis.
- From a single axis Ortho mode, press F8 once
to disable the Ortho mode.
- From a single axis Ortho mode, press F8 twice
in sequence to enable double axes Ortho mode.
Tape
Measure tool
Use the Tape Measure tool
to measure the distance and angle from one point to another.
To measure a distance
- From the menu,
choose .
or
Click the Tape Measure tool
on the Tools toolbar.
 The Tape Measure
button.
The Tape Measure
button.
- Click the starting point for the measurement.
- Click the end point of the measurement.
Result: The length and angle of the specified trajectory
displays in the status bar.
Tip: When selecting the starting and end points
for the measurement use the snap tools for precision. For details about
the snap tools, see “Snaps”.
Angle
tool
The Angle tool
enables you to measure and display the angle between two intersecting
lines.
To measure an angle
- From the menu,
choose .
- Pick the starting point of the measurement.
- Pick the end point of the measurement.
Result: The angle between the two intersecting lines
is displayed on the cursor’s information tooltip and in the bottom left
corner of the Status bar.
Position tool
The Position Tool
helps you determine the position of your selected object or objects in
the Drawing Wireframe, providing the precise coordinate reference numbers
for the X, Y and Z axes.
The Position Tool
can be used to change the position of your selected object or objects
by specifying new coordinate numbers for the X, Y and Z axes.
To use the Position Tool
- Select an object in drawing wireframe view.
- Click the Position Tool
tab.
Result: The Position Tool window
appears showing the selected object’s reference coordinate numbers in
the X, Y and
Z scroll boxes.
- Click the X, Y or Z scroll
box arrows to increase or decrease the reference coordinate numbers.
or
On the Position Tool window,
you may click the X, Y and
Z boxes and type the numbers.
Result: The position of the selected object(s) changes
according to the new coordinate reference numbers.
Notes:
- You can select more than one object and you can
move more than one object.
- If multiple objects are selected and arrow buttons
are used, the objects move to relative positions.
- If multiple objects are selected and a coordinate
value for an axis is entered, the objects move to the same position.
For example, if multiple objects are selected and you entered a coordinate
value in the Z
axis box, the objects move to the same Z axis coordinate.
- The increment/decrement size is equal to the
Grid Interval property
in Document Options > Draw
Defaults tab.
Position tool shortcuts
You can open the Position
Tool using the following shortcuts:
- CTRL + ALT + P:
Opens the Position Tool window.
- CTRL + SHIFT + X:
With an object selected, opens the Position Tool window
and the cursor in X.
- CTRL + SHIFT + Y:
With an object selected, opens the Position Tool window
and the cursor in Y.
- CTRL + SHIFT + Z:
With an object selected, opens the Position Tool window and the cursor in
Z.
Command
line
The command line is an area in Vivien where
you can enter coordinates for the purpose of placing or editing objects
in a document. You can often place objects more quickly and with more
precision using the command line.
Generally, coordinates are specified X,
Y, Z. You can, however, insert coordinates using either two or three values.
When using two values, the third value is assumed from the Height. For
more information on the Height, “The Height value”.
The values that you specify when the units
are set to imperial are assumed to be in feet unless otherwise specified.
Similarly, the values that you specify when the units are set to metric
are assumed to be in metres unless otherwise specified. You can at any
time specify values in both imperial and metric measurements (for example,
5”, 3cm, 6’).
The following example illustrates the many
different methods to use the command line.
Example
- In a plan view, from the menu,
choose .
- Type 0,0 as the starting point of the line.
Result: When you start typing, the Command
Line toolbar opens.
- Press ENTER to
establish the first point of the line at the origin.
- To set the next point at exactly X=5 and Y=5,
type 5,5, and then press ENTER.
Result: A new line segment displays and it assumes
Z from the Height.
- To place the next point of the line 10 units to
the right and 5 units up (in Y) from the last point, type @10,5 and
press ENTER.
Result: A new line segment displays.
- To place the next point at exactly 5 feet, 3 metres,
and 6 inches from the last point, type 5’, 3m, 6”, and then press
ENTER.
Result: A new line segment displays.
- When you are finished drawing the lines, right-click
and select .
Layers
Layers are drawing aids that help you organize
your drawing. One way to think of layers is as transparent acetate sheets
upon which you can draw. In the same way that you can view several transparent
sheets at once by placing them on top of each other, you can hide and
show layers by choosing which sheets are in the stack. The top sheet is
the layer that new objects are placed on and is called the current layer.
You can also merge layers together if you decide that you need to combine
one or more layers.
Note: Layers can be extremely useful drawing aids,
and are recommended for every file that you work on. For example, you
could create the following layers to organize every file:
- "Venue" (which is created automatically
when a Venue is drawn)
- "Tables and Chairs"
- "Misc Furniture" (such as Podiums, bars,
food tables, etc.)
- "Stage"
- "Lighting"
- "People"
To find out the layer to which any object
in your plot is assigned, just hover over the object with your cursor
in any of the wireframe views. A tooltip appears listing the object name
and its layer. This is especially useful when you are working with multiple
layers, some of which have the same color.
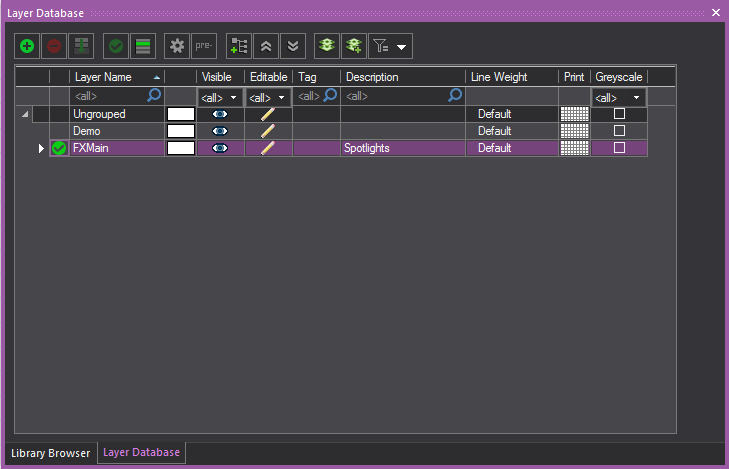
Layers can be organized into Layer Groups
in the Layer Database window. The Layer Groups
feature is enabled or disabled from the Document
Options window. Layer Groups can be created, viewed, modified and
deleted in the Layer Database window. Refer
to “Layer
groups”.
Adding layers
To create new layers
- From the menu, choose .
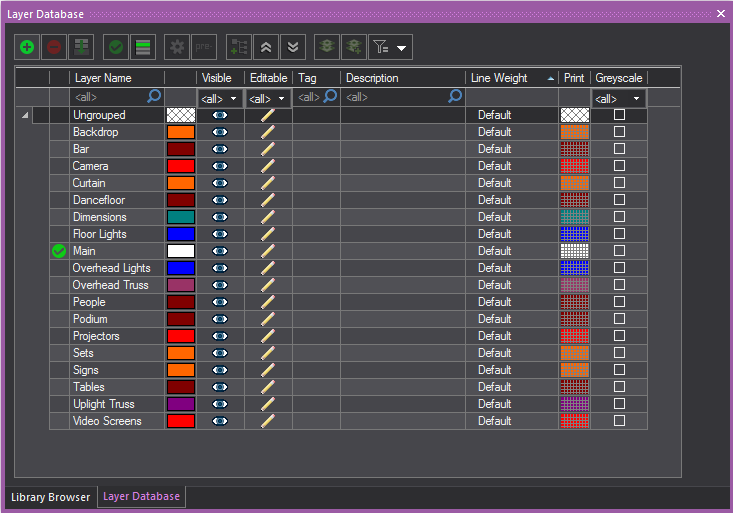
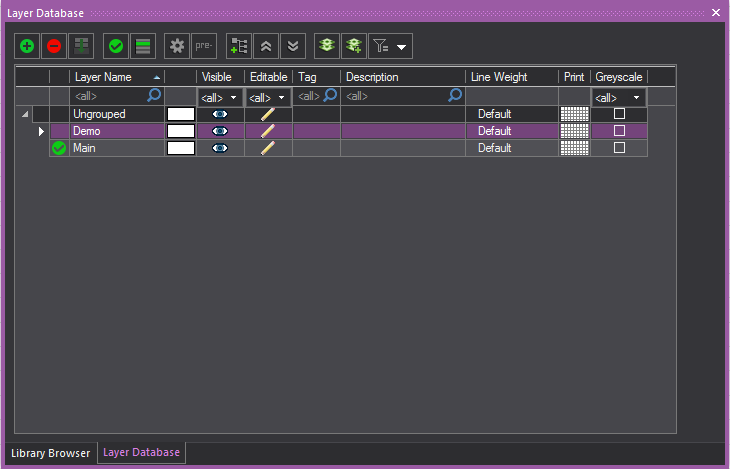
Result: The Layer Database
window appears.
- To create a new layer, click the New icon.
 The New button.
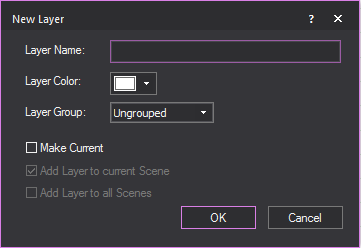
- Type a new name for your layer (for example, “Stage”).
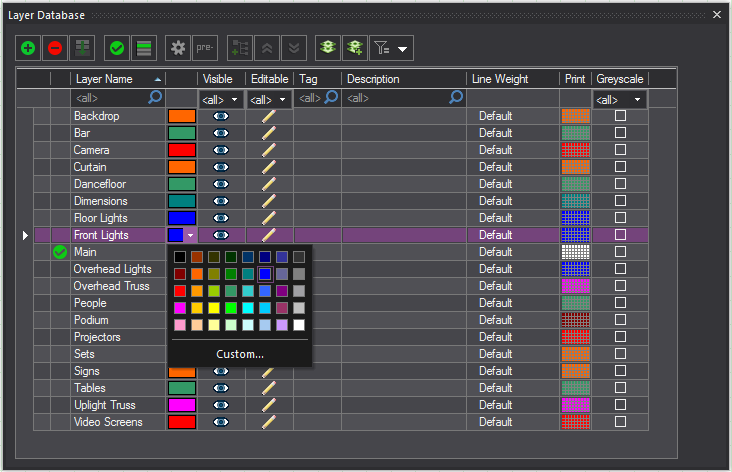
- Choose the color for the objects in the Layer,
from the Layer Color color picker
box.
- By default, the new layer is ungrouped but you
may choose to set the new layer as part of a group if available from
the Layer Group drop-down list.
- Choose from the options: Vivien maintains this
setting for the next layer that you create.
- Make Current sets
the new layer as the current active layer.
- Add Layer to current Scene adds
the new layer to the current active Scene.
- Add Layer to all Scenes
adds the new layer to all the Scenes.
- Click OK.
- To make a layer and all objects on the layer visible
on the plot and in virtual views, select the Visible icon.
If not selected, the layer is not visible and is not, therefore, editable.
- To make a layer and all objects on the layer editable
on the plot and in virtual views, select the Editable icon.
If not selected, the layer is not editable and is not, therefore,
visible.
Tip: You might want to deselect a layer when you
are finished working with it to avoid possible errors while working on
other parts of the plot. This is similar to freezing in AutoCAD.
- To change the color of the layer, click Color Select.
Note: It is recommended that you select different
colors for each layer so as to easily identify the layers on the plot.
Tip: To learn more about the colors in which objects
can appear, see “Rules for objects’ colors in Vivien”.
- To change the line weight of the selected layer,
choose the applicable thickness from the Line Weight drop-down box. If you leave
Default selected, the line weight
from the Object Settings tab is applied
to the selected layer. The line weight that you select applies to
all objects on this layer (including library objects, pipes, and truss)
and is visible in all Wireframe views in all modes.
- To set a different Print Color for a layer (while
preserving the actual Layer Color), choose the color from the Color Select box under the Print column.
By default, the Print Color is set to the Layer Color, and this is
identified by the Color Select box
shown with a checker pattern to identify them as the same. When the
Print Color is set to a different color, the selected color will appear
in the Color Select box.
Note: The print color will be displayed in Layouts
and New Plots when it is set to a color.
- Select the checkbox on the Greyscale column
to override the color of the layer and display it in greyscale, while
preserving the actual layer color. This will display it in greyscale,
while preserving the actual layer color. This will display the layer(s)
as grey, while another layer, which may be more important in the plot,
will be displayed in their color and be more visible in the plot.
Note: When layer(s) are set in greyscale, you can
change how the objects in the layer(s) will be displayed in the General tab in User
Options. See “User
Options”.
- To view the properties of a layer (for example,
name, color, and inventory of objects drawn on the layer), click the
Layer Properties icon. For more information
on these properties, refer to “Layer properties”.
 The Layer Properties button.
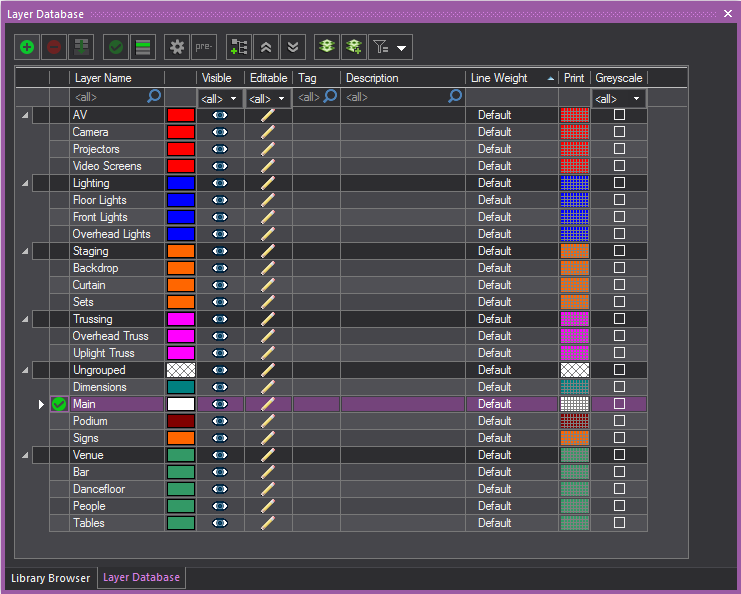
- Before closing the dialog, set your current layer
by highlighting it, and then clicking Set Current.
Alternately, you can set the current layer buy double clicking in
the first column on the left, beside a layer name.
 The Set Current button.
Note: The current layer is the layer that you are
working on at the moment – any object that you draw is placed on this
layer and assumes the layer's default properties when it is drawn. A check
mark appears beside the name of the current layer.
- To view and modify the scenes in which a layer
is included, select a layer, and then click Scenes.
For details, see “Scenes”.
 The Scenes
button.
The Scenes
button.
- Click OK to close
the Layers dialog box.
Notes:
- To quickly sort the layers within the layer database,
click the appropriate column heading in the Layer
Database dialog box. For example, click the Editable column
heading to sort the layers by edit setting; that is, those layers
marked as editable appear at the top of the list in alphabetical order.
- How columns appear in the Layer
Database can be edited. The
order of columns can be changed by clicking on a column header and
dragging it left or right to the desired position.
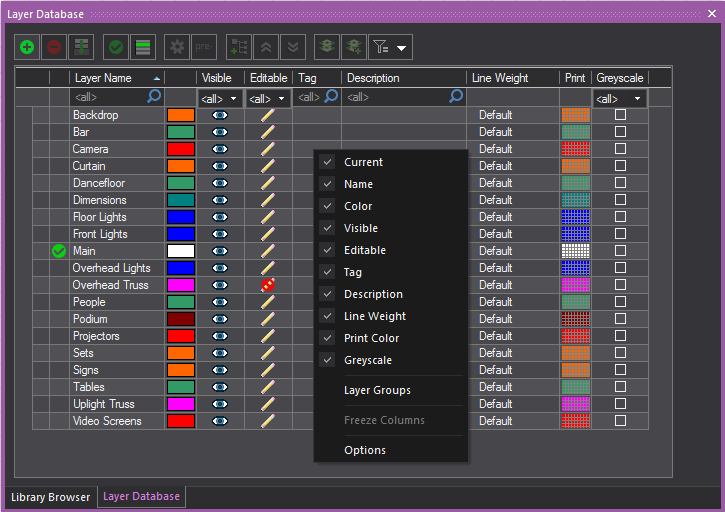
- To show/hide columns, right-click anywhere in
the table area, then select or deselect the columns from the displayed
list.
- To freeze columns, right-click on the heading
of the column and select Freeze Columns
in the displayed list.
Merging layers
After you add layers, you can merge two
or more of them together if you decide that you need to combine them.
To merge layers
- From the menu, choose
- In the Layer Database window,
hold CTRL and click to select the
layers that you would like to merge together.
- With the layers selected, click the Merge
Layers button .
 The Merge Layers button.
Result: Vivien asks you to specify the Target Layer,
or the layer to which the additional layers will be merged.
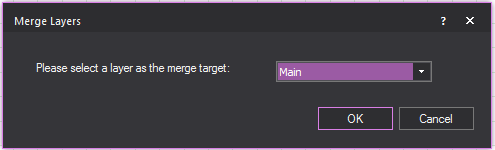
- From the drop-down box, select the target layer,
and then click OK.
Result: The layers are merged, and you will see only
the target layer (the one you chose to merge other layers into).
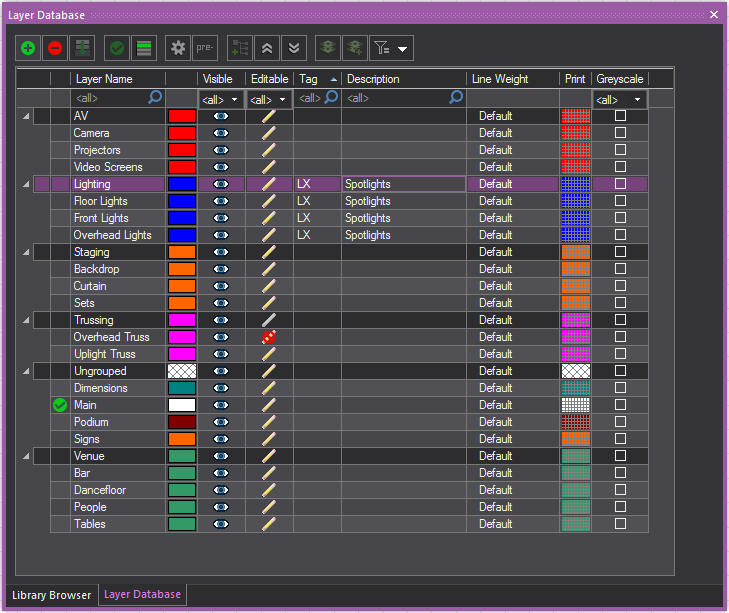
Layer highlight
You can highlight the current/active layer
automatically, by keeping only the current layer displayed in its layer
color while all the other layers are in greyscale.
To enable layer highlight
- From the menu, choose .
- In the Layer Database
window, highlight a layer.
- Click the Set Current button.
Alternately, you can double click the column on the left beside the
layer name.
- Click the Layer Highlight button.
 The
Layer Highlight button.
The
Layer Highlight button.
Result: The highlighted layer will be displayed in
its layer color and all the other layers will be in greyscale.
Note: You can change the color of the highlighted
layer in the General tab in User
Options. See “User
Options”.
Layer
properties
All layers have properties that describe
the appearance of the layer. Objects that reside on the layer inherit
the properties of the layer by default unless you decide to override the
values. For more information on overriding object properties, see “Customizing
object properties”.
General tab
Options on the General tab affect the selected layer’s color, line
weight and visibility.
Note: To learn more about coloring objects, see
“Rules for objects’ colors in Vivien”.
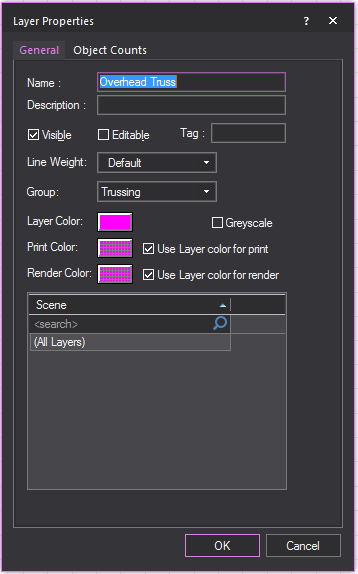
- Name:
The name of the selected layer.
- Description:
A description of the selected layer.
- Visible:
Check this option to make the selected layer visible on the drawing
and in Virtual Views. Modifying the property here changes it on the
Layer Database window.
- Editable: Check this
option to make the selected layer editable on the drawing and in Virtual
Views. Modifying the property here changes it on the Layer
Database window.
- Tag: A descriptive
tag applied to the layer. Used for sorting and categorizing information.
- Line Weight: From
the drop-down box, choose Default to
set the layer’s line weight to the default value specified on the
Object Settings tab. For more information,
refer to the “Object
Settings tab”. If preferred, you can also choose a specific
line weight for the layer. The value is used as the line weight for
all the objects that reside on the specified layer (including library
objects, pipes, and truss), unless otherwise modified. To modify the
line weight of an object, refer to the “General
tab”.
- Group: From the drop-down
box, choose the Layer Group where this
layer will be set into.
- Layer Color: Specify
the color of this layer to set the color of all the objects that are
displayed in this layer in all Wireframe views.
- Greyscale: Select
this checkbox to override the color of the layer and display this
layer in greyscale while preserving the actual color.
- Print Color: Specify
a different color for objects that reside in the selected layer when
printing the document. Select the Use Layer color
for print checkbox to use the same layer color when printing
the document. When the print color is the same as the layer color,
the Color Select box will show a
grey checker pattern to identify them as the same. When the print
color is different from the layer color, the Color
Select box will show the set color.
Note: The print color will be displayed in Layouts
when it is set to a color.
- Render Color: Specify
a different color for objects that reside in the selected layer when
rendering in Virtual View. Select the Use Layer
color for render checkbox to use the same layer color
when rendering objects in this layer. When the render color is the
same as the layer color, the Color Select box will show a grey checker pattern to
identify them as the same. To modify the object color for rendering,
refer to “General
object properties”.
- Scene: The scenes
that the layers appear in.
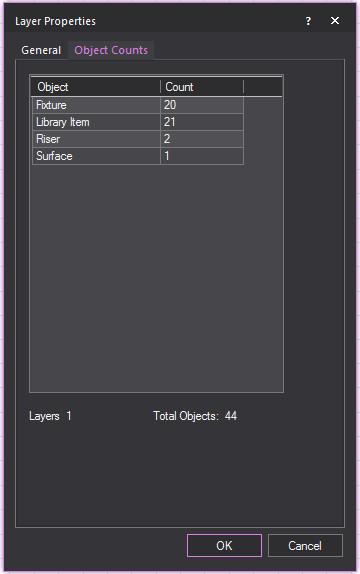
Object Counts tab
Entries on the Object
Counts tab indicate the total number of objects that reside
on the selected layer. Values on this tab are view only.
Layer descriptions
and tags
Once layers are created, descriptions and
tags can be added to the layers to easily sort the layers and show what
they are used for. The Description column
can contain a description of your layer, or any notes you wish.
Note: If you import an AutoCAD file containing text
in its Description column, the text will
be imported into the Description column in
Vivien.
To add descriptions and tags to layers
- From the menu, choose .
Result: The Layer Database
window appears.
- In the Layer Database window, click in the Description or
Tag field next to the layer you want
to add information to.
- Type in the information in the field.
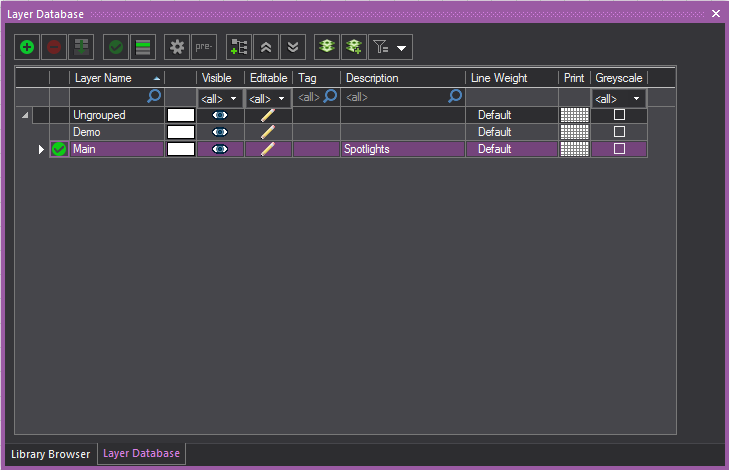
Result: The layer will have descriptive information
added.
Layer prefixes
The prefix tool is used to add a prefix
to the existing name of all the selected layers.
To add prefixes to layers
- From the menu, choose .
Result: The Layer Database
window appears.

- In the Layer Database window, select the layers you want to add
a prefix to.
- Click the Prefix button.
Result: The Change Layer Prefix
dialog box appears.
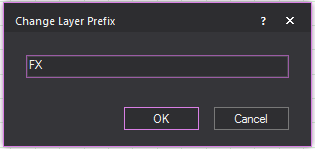
- In the Change Layer Prefix
window, enter the prefix you want to use.
- Click OK.
Result: The selected layers will now have the chosen
prefix before their name.

Adding filters to
the layer database
When using scenes, the Layer
Database can have filters applied so that only layers found in
the scene will be visible.
To filter the Layer Database
- From the menu, choose .
Result: The Layer Database
window appears.
- In the Layer Database window, click the Filter icon.
 The Filter button.
- In the filter list, select Layers
in the Current Scene.
Result: Only layers in the current scene will be visible
in the Layer Database.
Deleting layers
You must remove all objects from a layer
before you can delete it. You cannot delete the current layer.
To delete a layer
- Select all of the objects on the layer that you
want to delete and delete them or move them to another layer.
- From the menu, choose .
Result: The Layer Database
window appears.
- Ensure that the layer you want to delete is not
set as the current layer.
- Select the layer in the list.
- Click Delete.
- Click OK.
Tips:
- The Layer toolbar
gives you quick access to all existing layers and the Layer
Database. Click the tool on the left end of the Layer toolbar
to access the Layer Database.
 The
Layer Database button.
The
Layer Database button.
- Use the layer list in the Layer toolbar
to quickly set the current layer. If objects are selected when you
do this, those objects are moved to the selected current layer.
Layer groups
A Layer Group is a selection of layers
that are organized into a group in the Layer Database
window. One or more layers can be selected and set into a Layer Group
with a specified name. Properties that are set to a Layer Group will be
assigned to all the layers within the Layer Group. Layer Groups are created,
viewed and modified in the Layer Database
window. The Layer Group feature is enabled or disabled in the Document
Options window.
The ungrouped layers, by default are listed
under the group name “Ungrouped”, which can be renamed like any other
Layer Group.
In the Layer Database
window, the position of the “Ungrouped” group can be set to either top
or bottom of the displayed list.
You can also right-click on the Layer
Database window and click Layer Groups from the list to toggle
the display of Layer Groups in the Layer Database.
Creating layer groups
To create new Layer Groups
- From the menu, choose .
Result: The Layer Database window
appears with the layer groups enabled and displayed.

Tips:
- You can rename the Ungrouped layer, by clicking
the Ungrouped cell and typing the
new name.
- You can reposition the Ungrouped layer, by right-clicking
anywhere in table and choosing Options and
selecting Top or Bottom in
the Grid Options window. You can
also go to the General tab in the
User Options of the Document
Options window, see “User
Options”.
- Press and hold CTRL and select one or more layers.
- Click the New Group icon.
 The Layer Group button.
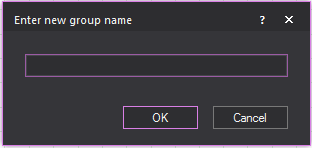
- Type a new name for your Layer Group.
- Click OK.
Result: The new Layer Group with all its layers is
added to the list.
- To make all layers in the Layer Group visible
or invisible on the plot and in virtual views, select the Layer Group,
then click the Visible icon. All
the layers in the Layer Group will not be editable if not visible.
- To make all the layers in the Layer Group editable
or not-editable on the plot and in virtual views, select the Layer
Group, then click the Editable icon.
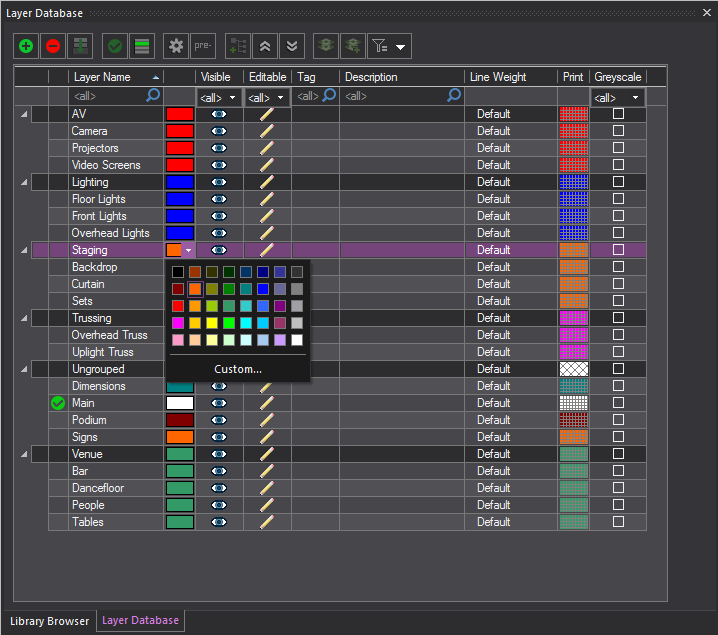
- To change the color of all the layers in the selected
Layer Group, click Color Select. All the
layers in the Layer Group will have the new color.
- To change the line weight of all the layers in
the selected layer Group, choose the thickness from the Line
Weight drop-down box. If you
leave Default selected, the line weight
from the Document Options window is applied
to all the layers in the selected Layer Group. The specified line
weight sets the thickness for all the object symbols in the associated
layers (including library objects, pipes, and truss) in the Layer
Group, defining how they will appear in all the Wireframe views and
printed Layouts.
- To set a different Print Color for the selected
layer group (while preserving the actual Layer Color of the group),
choose the color from the Color Select box
under the Print column. The print
color selected for the layers in the group will be displayed in Layout
and New Plots.
- Select the checkbox on the Greyscale column
to override the color of the layer group and display it in greyscale,
while preserving the actual layer group color. This will display the
layer(s) in the layer group as grey, while another layer, which may
be more important in the plot, will be displayed in their color and
be more visible in the plot.
Note: When layer groups are set in greyscale, you
can change how the objects in the layer groups will be displayed in the
General tab in User
Options. For more information, see “User
Options”.
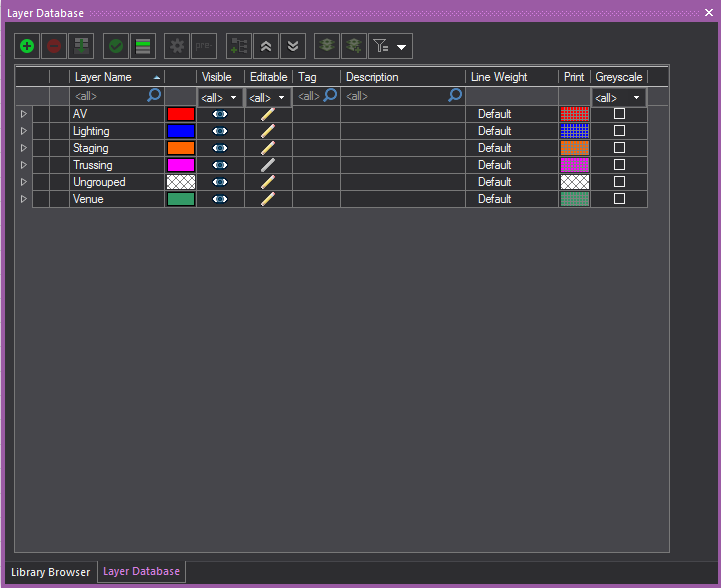
- On the list of Layer Groups, click the arrow at
the far left of each layer to expand or collapse a single Layer Group.
- Click the Collapse All
button to display only the Layer Groups.
 The
Collapse All button.
The
Collapse All button.
- Click the Expand All button
to display the Layer Groups and all the Layers.
 The Expand All button.
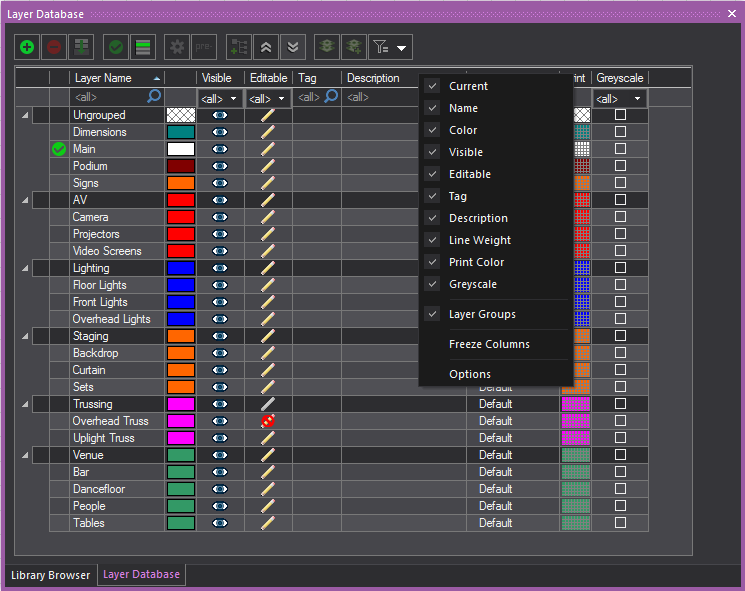
Notes:
- The use of Layer Groups can be switched off from
the Layer Database window. Right-click
the table area and from the list of columns that appear, clear Layer Groups. This links to the General tab
in the Document Options window and disables
the Enable Layer Groups option. Only
the list of layers will be displayed in the Layer
Database window.
- The order of how the columns appear in the Layer Database can be changed by clicking
on a column header and dragging it left or right to the desired position.
- To show/hide columns, right-click anywhere in
the table area, and then select or deselect the columns from the displayed
list.
- To freeze columns, right-click on the heading
of the column and select Freeze Columns
in the displayed list.
- By default, ungrouped layers are listed under
the group name Ungrouped, which can be changed, and listed on top
or bottom of the list of layers.
- To change the name, click the name and type
the new name.
- To change the position, right-click anywhere
in the table and click Options. Select
Top or Bottom in
the Grid Options window. You
can also go to the General tab
in the User Options of the Document Optionswindow.
See “User
Options”.
Layer group descriptions
and tags
Descriptions and Tags can be added to a
Layer Group which will be displayed to all the layers of the selected
Layer Group.
To add descriptions and tags to Layer Groups
- From the menu, choose .
Result: The Layer Database
window appears.

- In the Layer Database window,
click in the Description or Tag field in the row of the Layer Group
you want to add information to.
- Type the information in the field.
Result: The Layer Group and all the layers associated
will have the descriptive information added.
Moving layers between
groups
To move a layer from one group to another
- From the menu, choose .
Result: The Layer Database
window appears.
- In the Layer Database window,
highlight one or more layers you want to move.
- Click and drag the highlighted layer/s (NOT the
active layer) into another layer group where you want the layer/s
transferred.
Deleting layer groups
Deleting the Layer Group will remove the
Layer Group from Layer Database. All the layers
of the deleted Layer Group will be ungrouped and returned to the Ungrouped
group. All the settings of the deleted Layer Group will be removed from
all the ungrouped layers.
To delete a layer group
- From the menu, choose .
Result: The Layer Database window appears.
- Select the Layer Group from the list.
- Click the Delete icon.
 The Delete button.
Result: The Warning dialog
box appears to inform that the layers in this Layer Group will return
to the Ungrouped Group. Select the Always move associated
layers to the Ungrouped Group when Layer Group is deleted checkbox
and the Warning dialog box will not appear
again.
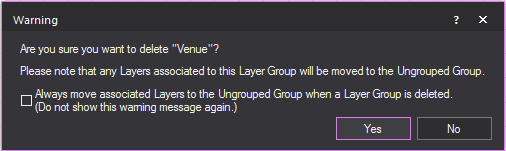
- Click Yes.
Scenes
Scenes are collections of layers used to
organize the drawing. A scene may contain one or more layers.
Hiding a scene hides all the layers assigned
to that scene. By organizing the layers and scenes in your drawing you
can quickly switch between different room setups.
By default Vivien creates two initial scenes:
Current Layer Only and All
Layers. You cannot delete these scenes.
You can use a keyboard hotkey to activate
and switch between scenes in your drawing. A hotkey is automatically assigned
to a new scene upon creation.
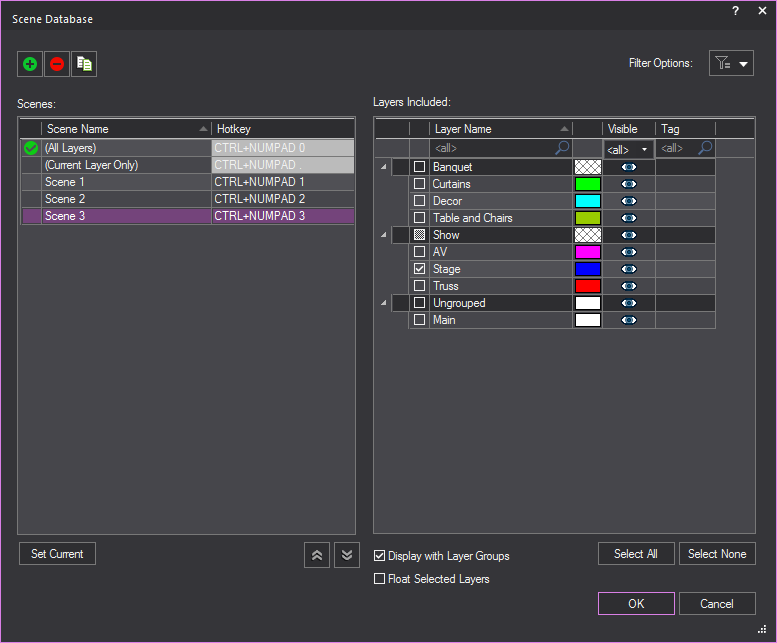
To create a new scene
- From the menu, choose .
Result: The Scene Database
window appears.
Notes:
- The default scenes All Layers and
Current Layer Only are always displayed
on top of the list, followed by all User-created scenes in ascending
or descending order.
- The Ungrouped group
of layers are displayed at the top or bottom of the list, as set in
the DocumentOptions > General
tab.
- The Scene
Database window will remember
its last size when you reopen it.
- Click New to create
a new scene.
- Type the name of the new scene and then click
OK.
Result:
- The layers associated with the scene are displayed
in the Layers Included box with selected
checkboxes.
- The new scene is added to the Scenes box
with its corresponding Hotkey (CTRL+NUMPAD
<1-9>)that was automatically assigned upon
creation and displayed in a separate column. See the “Dynamic scene switching” section
if you want to change the Hotkey of a
scene.
- On the Scenes box,
click on a scene or multiple scenes, and on the Layers
Included box, select the checkbox of each layer you want
to include in the selected scene(s). For more information, refer to
“Layers”.
Tip: Press and hold CTRL and
click on the scenes to select multiple scenes which you can edit or delete
together.
Notes:
- Click Set Current to
activate your new scene. If the current layer is not in the current
scene, you cannot add any objects.
- Click OK.
Tips:
- The Scenes toolbar
gives you quick access to all existing scenes and the Scenes
Database. Click the tool on the left end of the Scenes toolbar
to access the Scene Database window.
 The
Scenes button.
The
Scenes button.
- Pay special attention to the "(Current Layer
Only)" scene. As its name implies, this scene isolates the current
layer and shows only the items this layer contains. This can be extremely
useful when working with a complex object that requires editing, texturing,
and so on, or when adjustments need to be made to a complex show in
which objects overlap, or other complicated drawing scenarios.
To clone a scene
in scene database
- On the Scenes box
in the Scene Database window, select
a scene (or multiple scenes) that you want to copy.
- Click the Copy button.
 The
Copy button.
The
Copy button.
- Type the name for the cloned scene.
- Select the Set as Current
Scene checkbox if you want the cloned scene to become
current.
- Click OK.
Result: The cloned scene is added to the Scenes box
in the Scene Database window. The copied
scene has the same properties of the selected scene.
To remove a scene
from scene database
- On the Scenes box
in the Scene Database window, select
a scene (or multiple scenes) that you want to remove.
- Click the Delete button.
 The
Delete button.
The
Delete button.
- Click Yes on the delete
confirmation dialog box that appears.
Result: The selected scene is removed from the Scenes box in the Scene
Database window.
Dynamic scene switching
A keyboard hotkey is automatically assigned
to a new scene upon creation and displayed in the Scenes box on the Scene Database window.
You can use the keyboard hotkeys (CTRL+NUMPAD <1-9>)to
activate and switch between scenes. You can also change the hotkey settings
displayed on the Scenes
box.
To change or disable a hotkey of a scene
- On the Scenes box of the Scene Database window, select a scene with the hotkey setting
(CTRL+NUMPAD <1-9>)
that you wish to change.
- Click on the drop-down arrow on the Hotkey column
of the selected scene.
- From the Hotkey drop-down list of the selected scene, select
the new hotkey setting (CTRL+NUMPAD
<1-9>) or select <None>
to disable.